Infografiken für das Forschungsprojekt „AtlanticExiles“
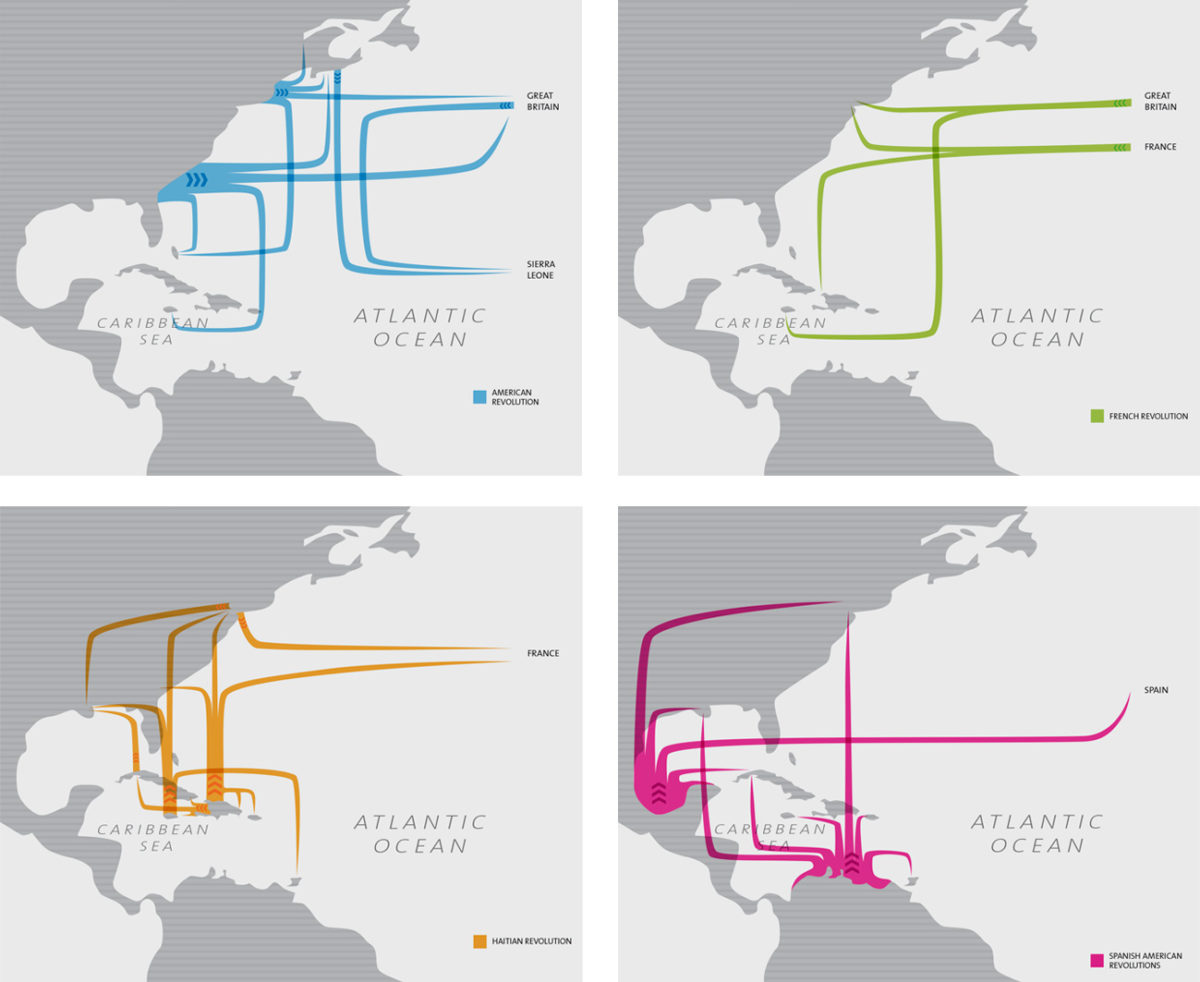
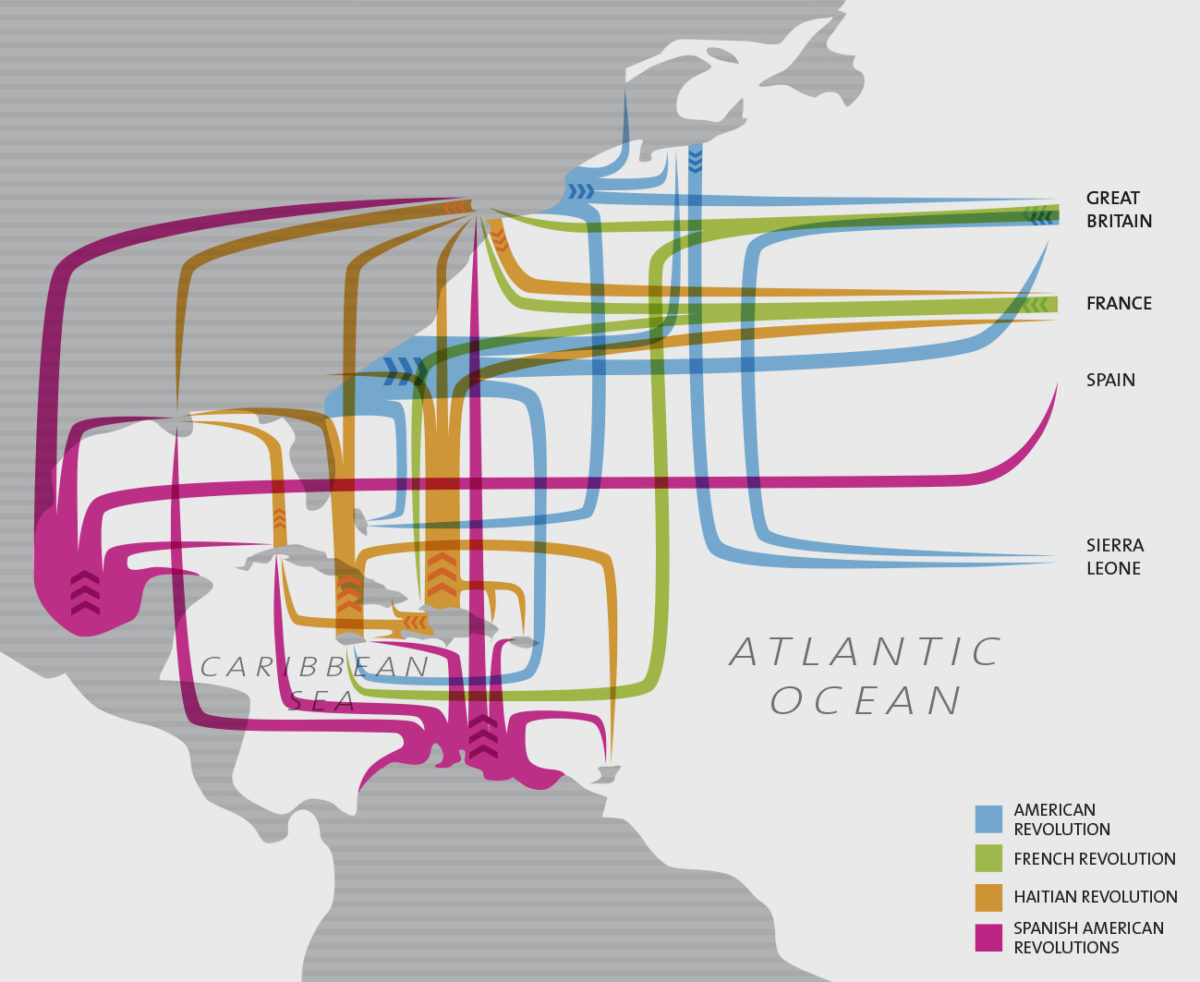
Für den Antrag eines Forschungsprojektes zum Thema Flüchtlingsströme im Atlantischen Raum innerhalb des 18. und 19. Jahrhunderts konnte Grafikbuero eine Informationsgrafik der unterschiedlichen Flüchtlingsströme gestalten.
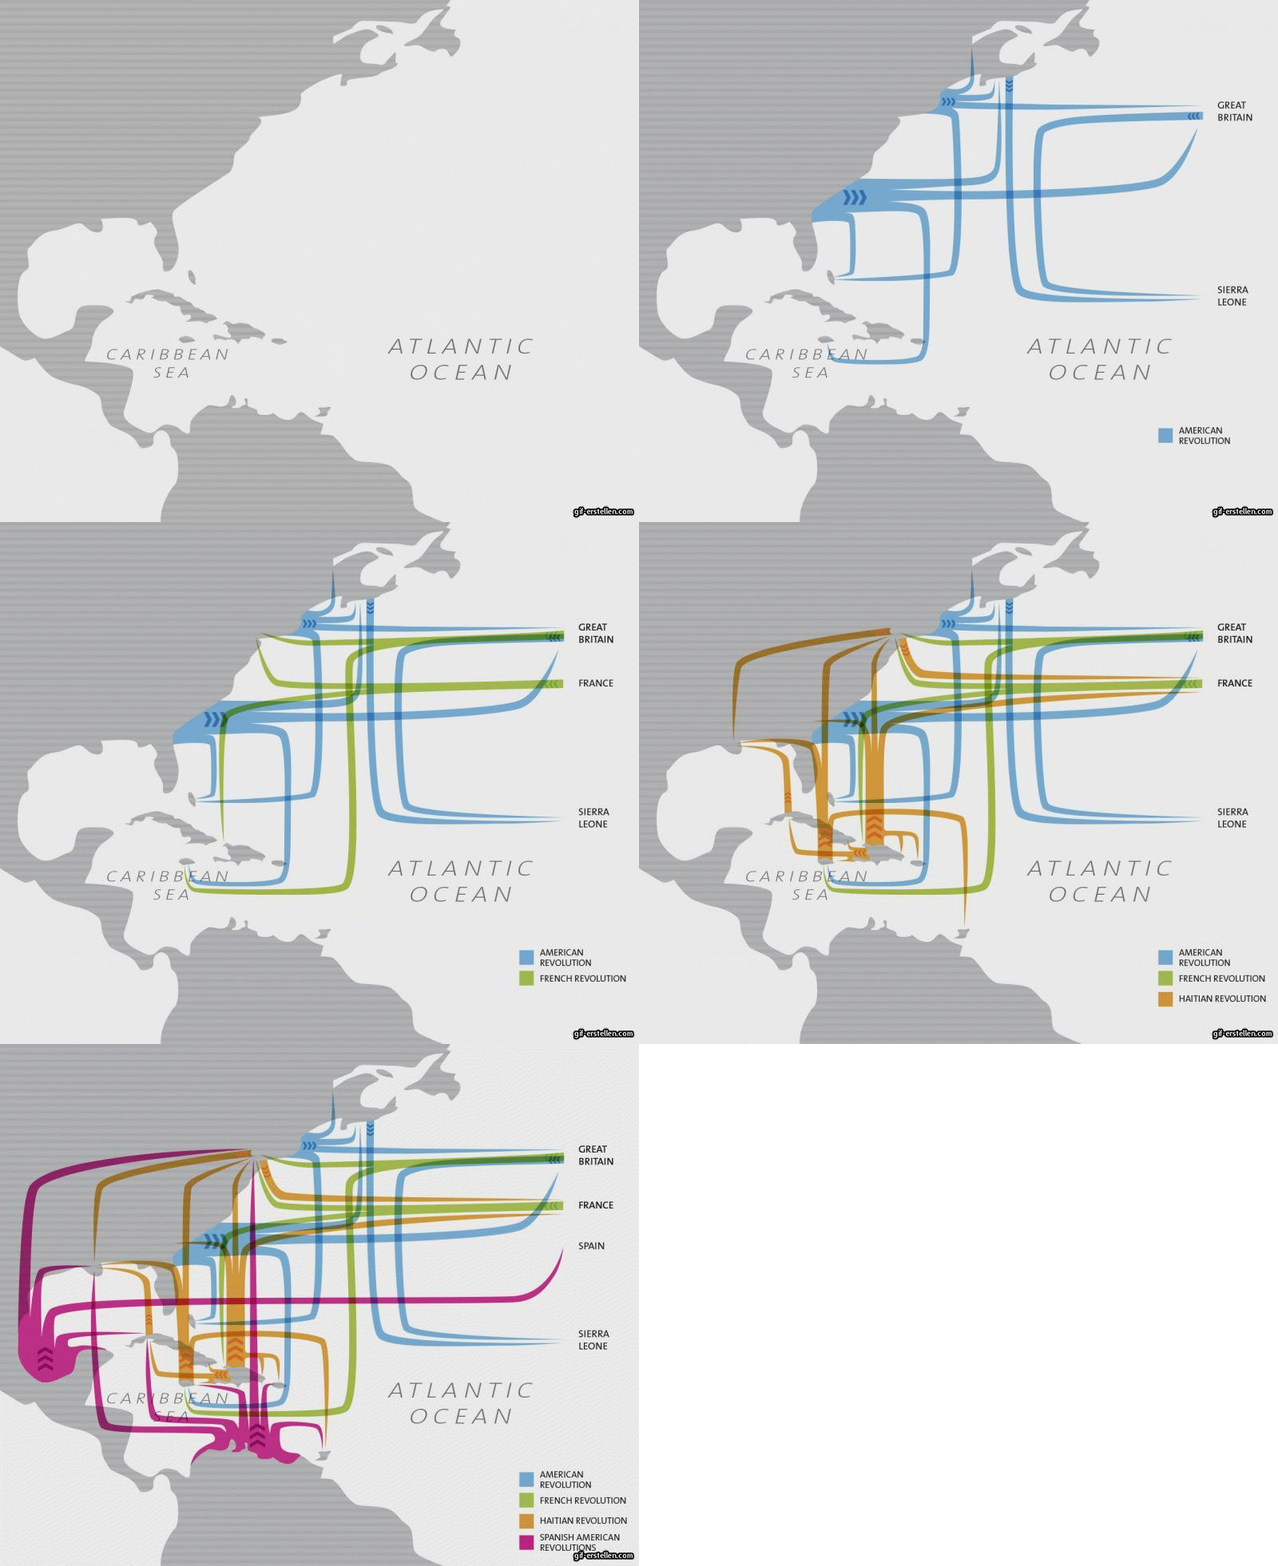
In der Präsentation sollte sich diese Grafik Stück für Stück aufbauen, hier zu sehen im GIF.
Zusätzlich wurden zwei Karten gestaltet, die unterschiedliche Orte und deren Verbindungen zueinander in den Fokus nehmen.
For the application of a research project on the topic of refugee flows in the Atlantic region within the 18th and 19th centuries, Grafikbuero was able to design an information graphic of the different refugee flows.In the presentation this graphic should build up piece by piece, here shown in GIF.
In addition, two maps were designed, which focus on different places and their connections to each other.


